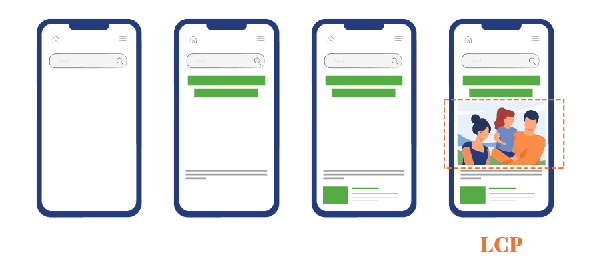
Largest Contentful Paint (LCP) measures how fast the largest element in the viewport of a page loads. Depending on the page, this might be an image, video, or text.
LCP homes in on what the reader truly values when it comes to page load and page speed. It’s a good indicator of perceived load speed — how long it takes the page to load from your reader’s viewpoint.
In the past, metrics like DOMContentLoaded, Time to First Byte (TTFB), and First Contentful Paint have all attempted to put numbers around this moment in user experience, but they fall short of being able to accurately measure what the user sees on their screen.
So what might affect a page’s LCP score? Let’s take a look…
Elements that are considered for LCP
LCP looks at the elements that load above-the-fold, narrowing down our search to the top of the page.
According to Google, the following above-the-fold page elements can be used for your LCP score:
Images:
- <img> elements
- <image> elements inside an <svg> element
- An element with a background image loaded via the url() function (as opposed to a CSS gradient)
Videos:
- <video> elements (if specified, the poster image is used to measure LCP)
Text:
- Block-level elements that contain text nodes or other inline-level text elements children
If your head is spinning from that technical jargon, not to worry! There are some simple ways to address LCP that do DON’T require you to dive into the code on your page.
The short & sweet version: above-the-fold images, background images, videos, and complex text blocks can contribute to LCP, so keep them optimized.
What causes poor LCP?
- Heavy or poorly optimized full-screen image downloads
- The order for loading content isn’t optimized
- Delays earlier in the page-load lifecycle, such as
- Slow server response times
- Render-blocking JavaScript and CSS
- Client-side rendering
- Slow resource load times
- Applying main content images as background images
How to measure and assess your LCP score
You can measure LCP with a variety of tools. Our guide to Core Web Vitals measurement tools looks at each of these in detail and shares what kind of data they offer.
Tip: Start in Google Search Console to assess the big picture LCP issues your site is experiencing. Search Console will show you an aggregate score for your entire site, which can help you prioritize overall issues before looking at individual pages one by one.
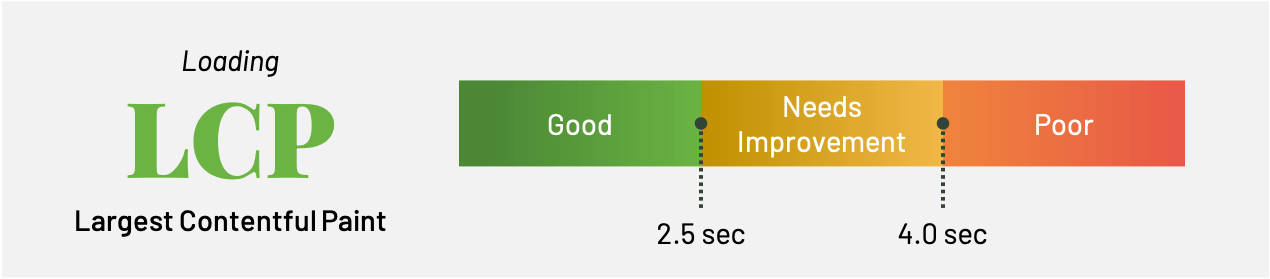
In terms of LCP scores, you want to aim for a load time of less than 2.5 seconds to be classified as “good” by Google. Slower than 4 seconds results in a “poor” score.
Room for improvement? First identify the issues affecting LCP.
To improve your LCP scores, first, you’ll need to identify what’s causing issues so you know what changes to make on your site. The testing tools and results can get into the technical weeds, so if you’re less tech-savvy, this might be a great time to hand over the reins to your developer to help optimize.
Here are some common issues and recommended improvements:
Slow server response times? Optimize your server, use a CDN, cache your site’s assets, serve HTML pages cache-first, and establish third-party connections early.
Render-blocking JavaScript and CSS? Minify your CSS and defer non-critical CSS and inline critical CSS.
Slow-loading resources? Optimize your images, preload resources, and compress text files.
Issues on client-side rendering? Minify critical JavaScript and use server-side rendering.
Getting to “Good”: four steps to improve your LCP score
If your LCP score needs a boost, the good news is that there is plenty you can do to move the needle.
Here’s a handy checklist of resources you can share with your developer to address the various issues that impact LCP.
1. Upgrade your hosting plan
- Look into a better hosting provider and/or plan to improve your site speed overall.
2. Optimize your images
- Compress images before you upload them to your site, or use a plugin that compresses images when you upload them
- Serve images in WebP format (as opposed to PNG or JPEG)
- Use responsive images and size your images correctly
Check out this article that has tips for image optimization!
3. Improve slow server response times
- Optimize your server
- Route users to a nearby CDN
- Cache assets
- Serve HTML pages cache-first
- Establish third-party connections early
4. Clean up your script
- Remove any unnecessary third-party scripts (for example, blogging network badges with built-in tracking)
- Minify your CSS
- Defer non-critical CSS
- Inline critical CSS
- Minify and compress JavaScript files
- Defer unused JavaScript
- Minimize unused polyfills
This Google guide breaks these down further into actionable steps!
Dig deeper on LCP:
- Google Web.Dev | Optimize Largest Contentful Paint
- Shay Toder | How to Improve LCP – Largest Contentful Paint
- Nolte | Improving LCP in WordPress: Part 1, Part 2
- Backlinko | Core Web Vitals
Your Core Web Vitals roadmap
Knowledge is power! Start here:
Dig deeper to understand each metric and why it’s important for user experience:
- What is Largest Contentful Paint (LCP)? [You are here!]
- What is First Input Delay (FID)?
- What is Cumulative Layout Shift (CLS)?
Benchmark your site’s Core Web Vitals, so you understand your starting position:
Make a step-by-step plan to improve Core Web Vitals:
- Your four-step playbook for diagnosing and improving Core Web Vitals
+ a handy one-sheet to go over with your developer or host
Tackle low-hanging fruit:
- How to choose the right hosting service for a speedy site
- 5 tell-tale signs you’ve outgrown your hosting service
- How a good host can help boost page speed and improve Core Web Vitals + a checklist for hosting optimizations
- How switching to a high-quality host can improve Core Web Vitals [Case Study]
- Use a CDN to help speed up your site
- 23 optimizations to improve your page speed and Core Web Vitals scores